 The TI-Nspire CX & CBR 2 The TI-Nspire CX & CBR 2 Solving linear inequalities in class had easily become a mundane topic to me. Students' prior knowledge was good, although they struggled a bit when the discussion changed to include absolute value inequalities.
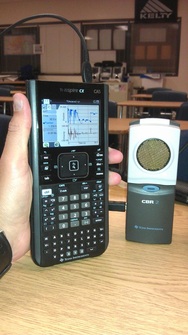
"Why is it so important we're able to phrase the distance from an object like that?" I had heard on several occasions. I DID have access to a Texas Instruments TI-Nspire CX as well as their CBR 2 (Calculator-Based Ranger), which had been useful in the past with a ball bounce lab and I fully intend this school year to do the Bungee-Jumping Barbie lesson. With CBR 2 and TI-Nspire CX in hand, I began to collect data in the hallway outside my classroom during a passing period with students walking by at a variety of distances away from the sensor. This was insightful, but did little to give relevance to the idea of absolute value inequalities as I had set out to do.
So after thoroughly banging my head against the drawing board, so to speak, I decided to relate the back-up sensor (and camera) on an automobile to the compound inequalities and absolute value equations we had been investigating earlier in the week.
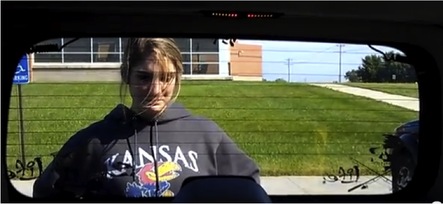 She seems to have a lot of faith in my backing skills, huh? She seems to have a lot of faith in my backing skills, huh? After searching far and wide to find a teacher's vehicle new enough to include a back-up sensor system, I then found two "willing" students to help me stage and record an example of the alarm system at work, with visible warning lights above the rear window in the photo shown). We -- er, actually, I -- backed the vehicle towards our volunteer (pictured here, seen through the vehicle's back window, exercising every ounce of trust she can muster up) and measured her distance to the sensor when it changed intensity and/or volume. The video was simple enough to capture, so I uploaded it to YouTube HERE, if you feel the need to use it in 3-Act-Math format (and because I always enjoy working a Dan Meyer shout-out into a blog post). My intent was to use the video clip as an Act 1, then the photo below for Act 2 to include some accompanying details and measurements. I have not managed, at this time, to accumulate the necessary camera shots for an Act 3, but hope I can do so in the not-too-distant future.
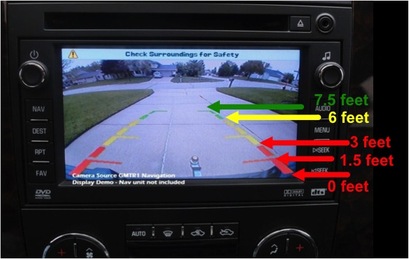 Image reflects data collected from observed alarm-distance relationship. Image reflects data collected from observed alarm-distance relationship. I found a screenshot of the new backup sensor/camera system available for the new Chevy Silverado and labeled its colored guidance lines to correspond with the observed distances when the audible and visible alarm system was set off during our trials. The prompt I gave students was that they needed to be able to provide enough information about the inequalities associated with each tone, so that we could construct a "poor-man's vehicle backing system." To be fair, earlier in the week, we had created several of our own programs to use with the TI-84 Plus (now available in the TI-84 Plus C with color screen and rechargeable battery, which I've grown to appreciate quickly) calculators, including Quadratic Formula, Distance Formula, Slope Formula, and Midpoint Formula programs. I aim to include links to these files as soon as my school webpage editor is properly troubleshot. For now, you may browse my classroom webpage using THIS link. While this particular prompt may not fit the ideals for the Common Core State Standards for Mathematics, I feel it does give some worthwhile insight into how computer programming logic has a place in a vital component of vehicle safety systems. Sometimes, this sort of insight is enough to squelch the "But when am I ever going to USE THIS STUFF in real life?" questioning that can occur frequently with math topics.
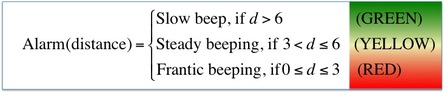 If using the 3-Act Math format, this could serve as Act 3 for the time being. Sorry. If using the 3-Act Math format, this could serve as Act 3 for the time being. Sorry. The relationship I had hoped students would construct, or at least mimic, in their analysis of the video clip I created and the accompanying photo shown above.
Most importantly, I wanted to see that students had the wherewithal (yes, I used "wherewithal" in context on a math blog entry) to only include, for example, "6 feet" as part of a single interval instead of assigning it to more than one interval. My hopes in this was to have some sort of reinforcing example to refer to when we begin our look at functions and how each input value can only have one output value.
With this sort of application to the simple, compound, and absolute value linear inequalities we have used this unit, I hope that my students have some sort of foundation or respect for how this topic is relevant and useful in real life. The female student in the video seems pretty bold to stand firm, knowing that I'm backing up straight towards her and, truth be told, there was a Counselor's meeting going on while we were filming in the conference room directly behind her. So, I had some explaining to do when I ran across a couple of those counselors towards the end of the school day, but did get some head nodding and encouragement that the lesson potential for what I was doing sounded pretty interesting to them. In conclusion, this lesson has been the most fun I've had ALMOST intentionally backing over a student in my teaching career. Just wanted to put that out there. Please let me know your thoughts on this lesson and check my Twitter feed to see when I've been able to post those TI-84 programs, if you are interested in when I have those posted. Thanks! --Keltner--
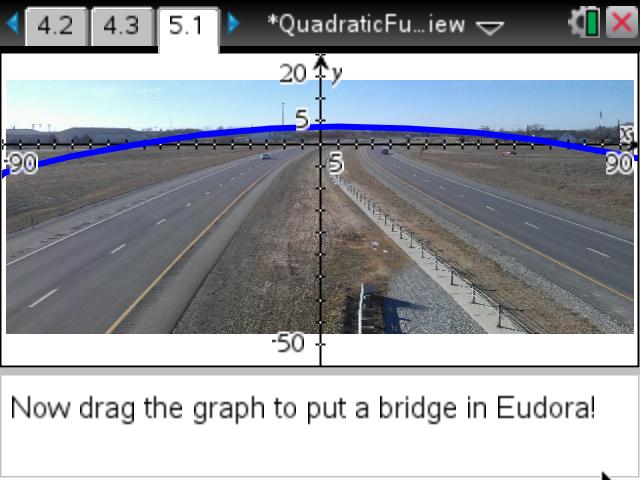
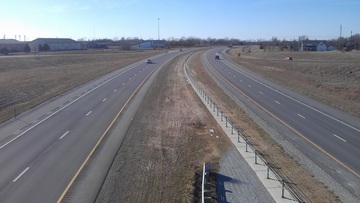 A view overlooking Kansas Highway 10 through my town. Give them something they can relate to in real life, right? Well, quadratic functions have numerous applications (most noteably Dan Meyer's basketball shot example using the 3-Act structure) but some are a stretch of the imagination for most algebra students. I don't think I knocked one out of the park on this activity, by any means, but it definitely had students engaged and talking. To elaborate on the picture at the left, our town is working on a grant application through the Kansas Department of Transportation to install a pedestrian bridge over Kansas Highway 10 and seeking community support for the project. You'll understand why this pedestrian bridge relates to the lesson shortly, I swear.
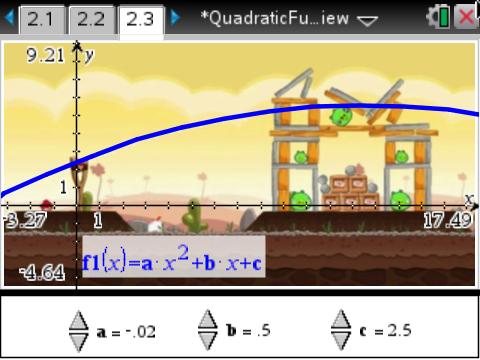
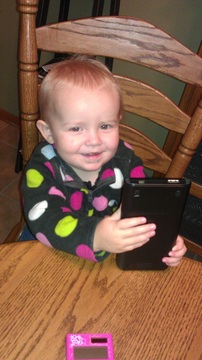 My 2-year old daughter & TI-Nspire CX. I used the TI-Nspire CX handhelds available to my classroom and was able to import pictures of objects that stressed the properties of quadratic functions in standard, vertex, and intercept forms each with a different context that I felt emphasized the form students were focusing on. (The .tns file for the activity can be downloaded HERE) Standard formThe y = a*x^2 + b*x + c form (yes, this post is letting me see how little formatting I can do with text on my blog), is where our focus began in our quadratics unit. I related this form to the path seen in Angry Birds (shown in the screenshot album below) since the path of the previous shot was visible on screen. I set up sliders to allow students to modify values of a, b, and c and watched them try to map the previous shot they saw. Some comments I heard: - "Dude, you gotta change c so it's your y-intercept to put the bird in the slingshot!"
- "Yeah, a has to be negative so it's concave down, but make it barely negative so the graph gets wider! Duh!"
- "Whoa, changing the value of b only swivels the graph from side-to-side!" (this was important as we worked later in the unit to factor quadratics)
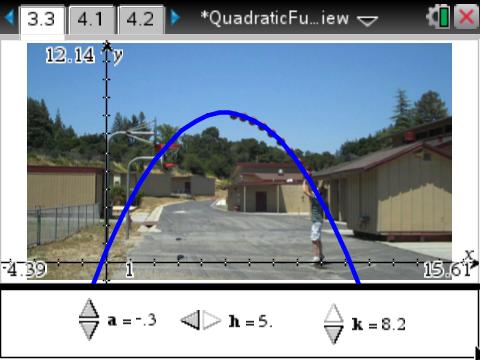
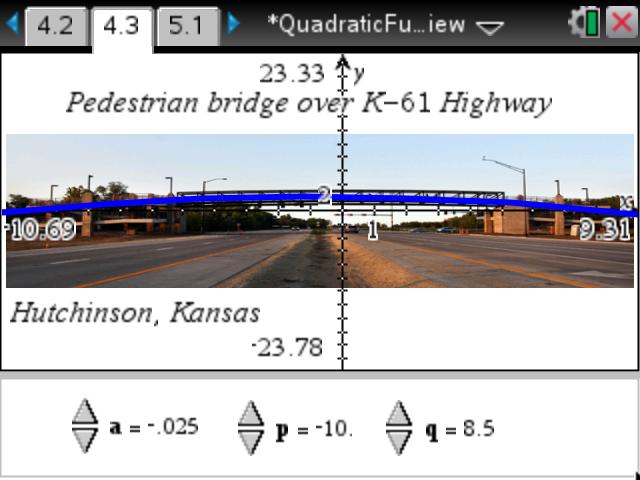
Most importantly, students were able to connect each constant (a, b, and c) to its unique impact on the shape of the graph, on their own terms--I just used Angry Birds to facilitate the process. The students carried their momentum into Vertex form next. Vertex formThe y = a*(x - h)^2 + k form, where the vertex is located at (h, k) was a fitting place for me to use Dan Meyer's basketball shot example , because students thus far were struggling with the idea of why symmetry was important in quadratics. They had already aced the idea of wider/narrower graphs and how that was critical to the graph's shape, but I used this to emphasize how each point on one side of the vertex also "secretly" corresponded to another point on the opposite side of the vertex. Intercept formThe y = a * (x - p) * (x - q) form that is shown many different ways in many different textbooks. This was going to be the grand finale, bringing in the pedestrian bridge project I'd mentioned earlier (the public information presentation can be found HERE, if you want to know more). I included an example photo of a pedestrian bridge in our state (over Kansas Highway 61 in Hutchinson) and students fit the graph by noting the x-intercepts on the scale that was overlaid on the photo. (Side note: they could also manually enter a value for the constants, they did not need to manually adjust values as small as shown). Several students also asked about why the towers at each side of the pedestrian bridge had to be so tall, which led us into a side discussion about height clearance and its importance to road traffic that would travel beneath (a decent review of inequalities).
So, as I was arriving at school the day after doing this lesson, the school secretary told me how cool it was to hear about my lesson at the Site Council meeting the night before. Apparently, my principal talked up the lesson during the public informational meeting THAT night in front of city administrator and some other city staff involved in the project, as well as numerous citizens in attendance. So, I received a couple emails that next day from several people expressing their thanks for having beefed up support for the project while also teaching the concept of the bridge in class. It's fun to have those "I wish my math teacher did things the way you do" moments, with the idea that parents who were at that meeting probably gave their students a pop quiz when they got home without my prompting. Sorry about that, kids. I'd mentioned a link for the TI-Nspire activity earlier, but HERE it is again if you want to use it or modify it for your own use. Even if you don't have a TI-Nspire handheld, you can give it a test-drive using the TI-Nspire Document Player HERE (open the Doc Player first, then download the activity and open it through the Doc Player interface). --Keltner--
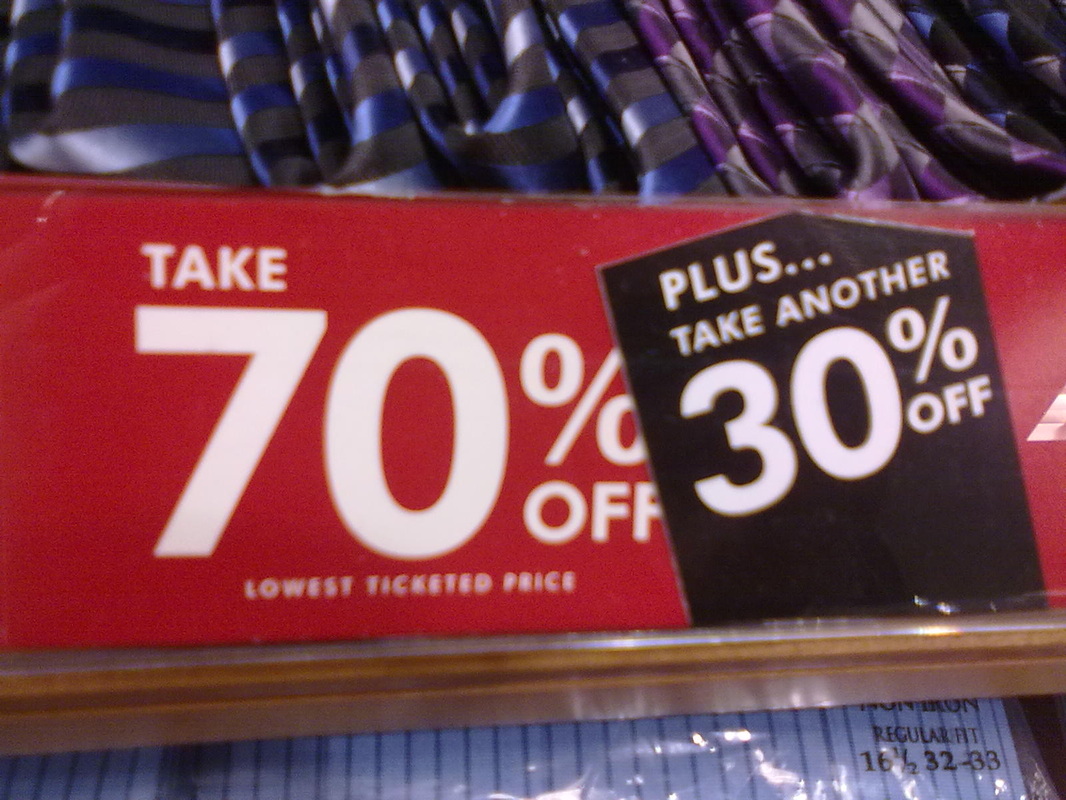
 In the spirit of Black Friday, let's see if we can save some green. Whether you are guilty of joining the Black Friday "festivities" or not, this lesson contains something for you to be aware of in your shopping with coupons.
If you have multiple coupons, of different discount types (amount discount vs. percent discount, that is), then there is a particular way to apply these savings that will earn more savings than the other.Long story short: Apply the percent discount before applying the amount discount for more savings.
The concept relies on the concept of composition of functions, commonly written in the form f(g(x)). These are functions that evaluate in one functions and then another, in a particular order. The topic puts emphasis on evaluating with the order of operations as well as other properties like the commutative property and associative property, both of which are staples in algebraic concepts.
 Remember, always use the percent discount FIRST when given the opportunity. Teaching this lesson in class works well, mainly due to the fact students get so wrapped up in seeing whether they know how to reap the biggest reduction on their purchases in the future. To help solidify their learning, or ward off skeptics on the topic, we try a couple examples: a $50 purchase and a $100 purchase, for ease of computation. Follow along: For a $50 purchase:- $10 discount applied first: $50 - $10 discount = $40, then $40 - (0.2)*$40 = $32 final price
- 20% discount applied first: $50 - (0.2)*$50 = $40, then $40 - $10 = $30 final price
For a $100 purchase:- $10 discount applied first: $100 - $10 discount = $90, then $90 - (0.2)*$90 = $72 final price
- 20% discount applied first: $100 - (0.2)*$100 = $80, then $80 - $70 = $70 final price
It is no strong coincidence that there is a two-dollar difference between these scenarios. This is the critical piece of what I'm trying to convey with this post (oh, and it's a fun math lesson to teach). In using the dollar-discount first, the consumer or retailer is causing the percent-discount to be applied to a smaller value, therefore not letting it stretch as far as it could otherwise. It is, in essence, as if you are also taking the percent OFF of the dollar discount you wish to use (note the examples above, where there is a $2 difference and $2 is 20% of $10). In applying the percent discount first, your percent covers the larger original purchase price and stretches further. This is the gist of why the percent coupon should be applied first, when you have the opportunity. NOTE: Some retailers have a point-of-sale system which is programmed to use the dollar discount first, no matter when you had a coupon to the cashier, so you might be forced to play their game and sacrifice part of your savings. I will not name names, but have had a couple of disappointed students bring in receipts and show me how much MORE they could have saved if the register didn't force the order of discounts applied. I'm making a bunch of links in this sentence if you would like either the TI-Nspire file I have shown up above in the slideshow, or the original presentation and handout I did for this topic to earn T^3 Instructor status a few summers ago. (Don't have a TI-Nspire? Try running the TI-Nspire file through the TI-Nspire Document Player without a need for download of software.)
 A 101qs.com entry I posted in May, 2012. This was a head-scratcher but good example. I managed to take a trip to an outlet mall, where I saw a curious sale display, pictured at left. To use the word "PLUS" in this instance seemed additionally confusing (yes, pun intended there), and caught the ire of Dan Meyer on his blog shortly after I'd posted the photo to 101qs.com. This, and other sale opportunities like it have been a common cause of commotion in class among my students who have heard me teach this lesson. They are able to bring up new shopping adventures they have had, where they might have corrected the way a cashier had rang something up, or a discount was applied more favorably than they expected, or the discount merely balanced out the sales tax they would have paid anyway. Regardless, the lesson sticks. Applying similar, consecutive discounts have proven to be a decent introduction to exponential growth, since students are aware that "50% off, then another 50% off does not make the item FREE." For those students who are very shopping-savvy, these applications hit home for them much more quickly than any compound interest problem ever could. Speaking of interest, I hope this sparked some of yours. Have a good day and enjoy the holiday season, saving all the while! --Keltner--
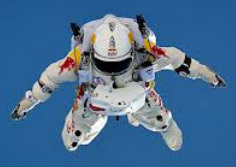 Click for Red Bull Stratos mission website. For the casual observer--well, hang on--no one casually observed Felix Baumgartner's jump from the edge of space on October 14th, 2012. Not everyone who watched had their mind racing like mine was, but I am certain that this feat is one more than befitting of #101qs and #3Acts formatting. What follows on this post is what I have managed to use in my own class to help quench students' curiosity about the Red Bull Stratos project, which sent a helium-filled balloon up to 128,100 feet and had Austrian skydiver Felix Baumgartner jump back to the Earth wearing a pressurized suit.
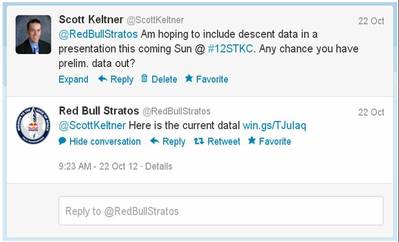 I got a response back from Red Bull Stratos! This coming Sunday morning, I will be presenting at the STEMtech Conference in Kansas City and was hoping to use an example from the Red Bull Stratos jump within my talk to show how velocity, acceleration, deceleration, and time can relate to one another--both for the balloon's ascent and Felix's descent back to the Earth. So, I tweeted the Red Bull Stratos folks. With 240,000+ followers, I figured it had fallen on deaf ears (although, since they're used to travelling faster than the speed of sound, they could use "I couldn't hear you" as a valid excuse). Nevertheless, I set out to collect some data points for use on the TI-Nspire CX using the Teacher Software. Below is a slide show of some of the work I completed. What I hoped students would take away from these graphs included: - The balloon appears to make a fairly constant ascent, but careful inspection would reveal the upward velocity of the balloon actually varied much more than at first glance.
- Does the elevation vs. time graph of Felix's descent convey enough information for us to know when he deployed his parachute? (This would be a great time to introduce the idea of a secant line to students, as a BRIEF introduction to a Precalculus and Calculus topics such as average rate of change and limits)
- Does the velocity vs. time graph of Felix's descent show enough to let us identify when he is accelerating and decelerating, when his parachute was deployed, and when he touched earth again?
Also, I'm including a link to the data I used to compile this activity on this post both as a Google Docs Spreadsheet and a Microsoft Excel file, and also the TI-Nspire CX document used here (this can be downloaded, then viewed within the TI-Nspire Document Player without needing software purchase or download of trial versions). Please use either however you see fit and let me know how it works for your class. The ascent data was gathered from this post on Wikipedia. The descent data was gathered by watching and pausing this YouTube video a couple different times (NOTE: these were approximate velocities and subject to verification and should not be considered 100% accurate, but did work well enough to conduct the lesson I was looking to convey).
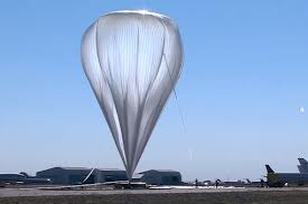 Click for more information on the Red Bull Stratos balloon. The other information I wanted to include in this lesson, but did not focus on in this lesson, included facts and figures about the balloon used in the Red Bull Stratos mission. At lift-off, the balloon was nearly 200,000 cubic feet (or 100,000 Giant Jenga games, as I was able to illustrate with my students in class, since we recently worked with it). At its highest point, the balloon was nearly 30,000,000 cubic feet large (which I related to my students by having them envision a cube that is as long, wide, and tall as a football field--a cube with side lengths about 310 feet on a side). Check this blog post on how the balloon compares with the Statue of Liberty When we approach a lesson that involves transformations of solids (impact on volume and surface area when a single dimension is altered), I will likely revisit this topic again with a different focus in mind. As much energy as my students brought to this lesson, then finding out that there were over 8 MILLION simultaneous YouTube viewers of the Red Bull Stratos mission (which was not mentioned on the mission's blog post among the other records and noteworthy feats achieved), I knew that this was a topic that would grab their attention. I also know how much my own mind was racing as I was watching the broadcast of the mission, so to leave it alone would be unheard of. But when the speed of sound was broken during the fall, that is the play on words I was hoping for: "unheard of." Mission accomplished. Thank you for being a great example to our students, Felix Baumgartner! Wait! An example in a lesson, I'm not saying that all our students should go jump in balloons and take up this sort of skydiving! There. I have to cover that segment of the population that will try and one-up this record by any means necessary. --Keltner--
|


 RSS Feed